In our recent report, State of the Fossil-Free Internet 2026, we show a transparency score based on four questions about company disclosures of how data centres are powered. We checked against the information published on what is one of the more complete open datasets on the topic, from a prominent industry group, the Green Software Foundation. In this post, our director of Technology and Policy, Chris Adams, explains why this dataset was chosen, the approach taken and shares a little more about each specific question asked in the visual.
Before we jump in, what transparency score are we referring to?
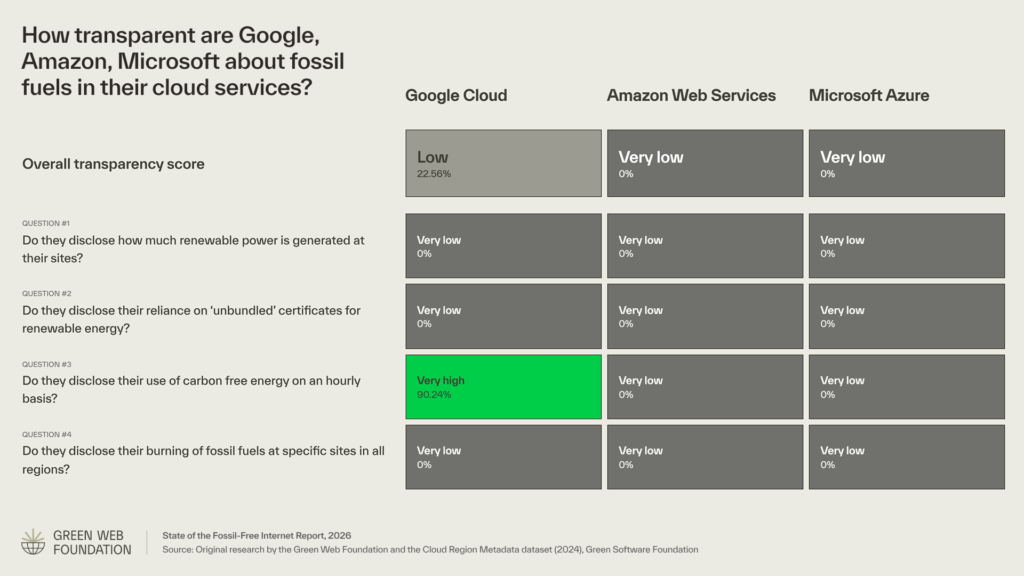
In our recent State of the Fossil-Free Internet report, one of the visualisations showed how much information was shared into the public domain by the largest three cloud providers.
The best place to see this table is on our report website, fossilfree.greenweb.org. For convenience, it’s reproduced below:
Why do we look at these three firms?
When we think about the global buildout of gigantic data centres changing the footprint of the internet, there are three companies, Alphabet, Amazon and Microsoft, who offer families of cloud services, under the names Google Cloud, Amazon Web Services, and Microsoft Azure respectively.
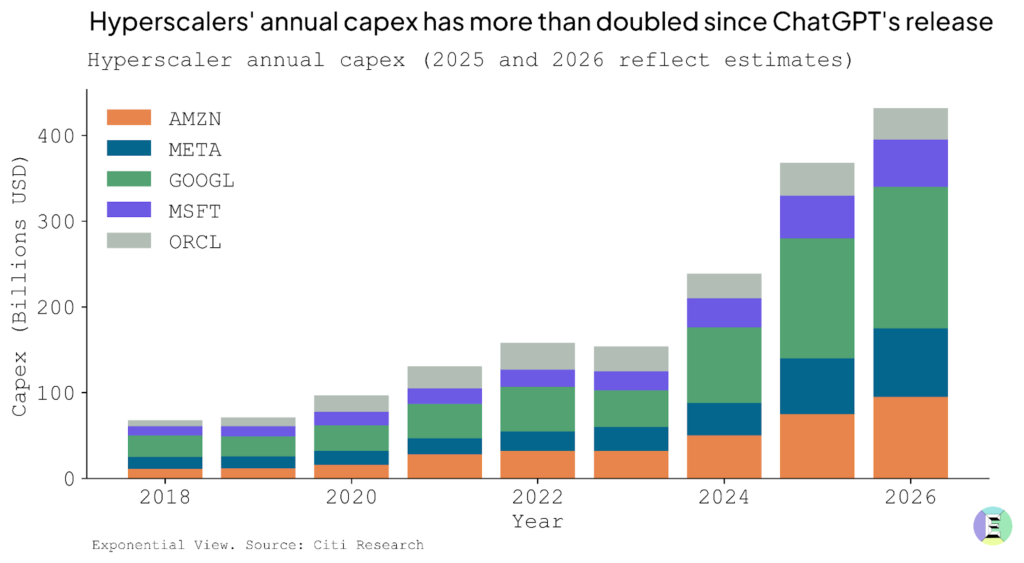
These historically have made up more than half of the hyperscale cloud market. When we look at the current, massive levels of investment in data centre buildout globally, they also make up a disproportionately large share of the capital expenditure, which has doubled since the release of ChatGPT.
The chart below shows that even taking into account the tens of billions invested by Meta and Oracle, consistently more than half of the investment has come from just these three companies
Why are they important for decarbonisation of the internet?
Since the boom in artificial intelligence, the total emissions of Alphabet, Amazon and Microsoft have been growing, but these companies have consistently also been the largest investors in clean energy in the corporate sector, with bold public announcements of net-zero targets. How they spend money on energy has a direct impact on how quickly the sector decarbonises.
Their structural importance and market dominance also now means that if you use any mainstream digital service in 2026, it’s likely that at least one of these cloud service providers is in its supply chain. Either you’re a direct customer of these companies, or one of your suppliers will be.
Faced with this, when we think about tracking progress towards a fossil-free internet, how these three companies disclose information is crucial to our understanding of what is happening across the internet’s infrastructure and in the software and apps we build and use worldwide.
What’s the importance of cloud regions?
Customers who are reliant on these companies have several levers to manage their emissions from using their cloud services. The most obvious way is to manage the amount of consumption of services in absolute terms.
Another lever named by all three companies is the choice of where specific services can be used. This is because intuitively, if electricity is a key driver of emissions from the use of digital services, and you consume them in a region of the world where the grid is ‘cleaner’, it follows that there would be lower carbon emissions. We might refer to this as location-based emissions from electricity.
However, we know that these companies are not just passive consumers of electricity on the grid. All three are very public about their own investments in green energy, so we need some way to take into account these market-based interventions to affect how ‘green’ the energy in use is.
However, when we talk about where to run computation, for the most part, even if a digital service might run on servers in a physical building, with its own latitude and longitude coordinates, the information that gets exposed to customers to help them decide where to run doesn’t directly refer to a specific data centre building in a specific city or country.
Instead, customers typically choose among specific named regions, which have much more abstract name like eu-west-1 (Amazon’s name for Dublin, Ireland), or northeurope (Azure’s name for the same city), or asia-northeast1 (Google Cloud’s name for Tokyo, Japan).
Because you’re choosing between regions, if you’re a customer of these cloud providers and you want to understand the difference it makes to deploy a service in one region compared to another, then it would help to refer to a public dataset that shows this information at a per-region level.
What did we base our transparency score on?
The Green Software Foundation is an industry association composed of dozens of tech companies, institutions and non-profits working together to solve sustainability challenges and exchange information on how to build greener systems. We chose the Cloud Region Metadata dataset by the Real Time Cloud Working Group of the Green Software Foundation as the basis for the transparency score in our report. The dataset was developed with early involvement from cloud service providers, and there was a rigorous process for collecting the data over the last two years, which we have actively participated in ourselves.
We’ve outlined the reasons below for using this dataset:
- It tracks all the regions the big three cloud providers made available to customers – this means information is available at a resolution that customers of cloud services can recognise, and see in their own dashboards. If people are choosing to deploy to one region over another for environmental reasons, then it makes sense to expose information at this level.
- It is a public dataset, created in the open with an open license—the source repository for the prospect uses a permissive MIT license, meaning this data can freely be added to other software projects or products, in commercial and non-commercial products.
- Each column is clearly documented, following existing standards where possible —the dataset uses information that is already collected to comply with existing reporting requirements, either from customers or to follow existing laws around the world, like the Energy Efficiency Directive in Europe.
- It is on a standards track to become a recognised, international standard for reporting information at a ‘region’ level for cloud services – the dataset is stewarded by the Green Software Foundation, which has a track record for establishing standards in the sector, like the Software Carbon Intensity ISO standard.
While there remain data gaps, this is currently one of the most complete datasets in the public domain that we can refer to, and the governance process is clearer than with most other datasets we have seen. We looked at the most recent available data at the time, which was for 2024.
For each of the questions we wanted to answer, we applied a score based on how complete the disclosure was for the regions in the datase (i.e. for a given column, how many of the possible rows actually had a usable disclosed value).
If we were looking at a column in the dataset listing hourly matched power (listed in the dataset as provider-cfe-hourly), and a cloud provider had a usable value for 90% of its cloud regions we would apply a “Very high” score for that column, based on the thresholds in the table below:
| Score | Percentage of regions with disclosed values |
| Very low | 0-20% |
| Low | 21-40% |
| Medium | 41-60% |
| High | 61-80% |
| Very high | 81-100% |
What did we look for in the dataset?
For the State of the Fossil Free Internet, we wanted to track progress towards the decarbonisation of the internet. We wanted to document how the trajectory has changed, compared to an earlier era of gradual decarbonisation that we saw in the late 2010s and early 2020s. However, we don’t have access to granular data in a standardised format that enables us to do this type of comparison—even for the three biggest companies in the cloud sector. Based on the (usually empty) data fields in this public dataset, we developed four questions (in plain language) that get to the heart of what we most need for transparency.
These questions are
- Do they disclose how much renewable power is generated at their sites?
- Do they disclose their reliance on ‘unbundled’ certificates for renewable energy?
- Do they disclose their use of carbon free energy on an hourly basis?
- Do they disclose their burning of fossil fuels at specific sites in all regions?
Let’s look at each question and what data is out there.
1. Do they disclose how much renewable power is generated at their sites?
When you say a data centre runs on clean, green or renewable energy, a lot of the time it conjures images of a building with solar panels on the roof, or wind turbines sited right next to the facility to power all the servers. Large companies do very little to dispel this image—just see the example from Google’s data centre site below.
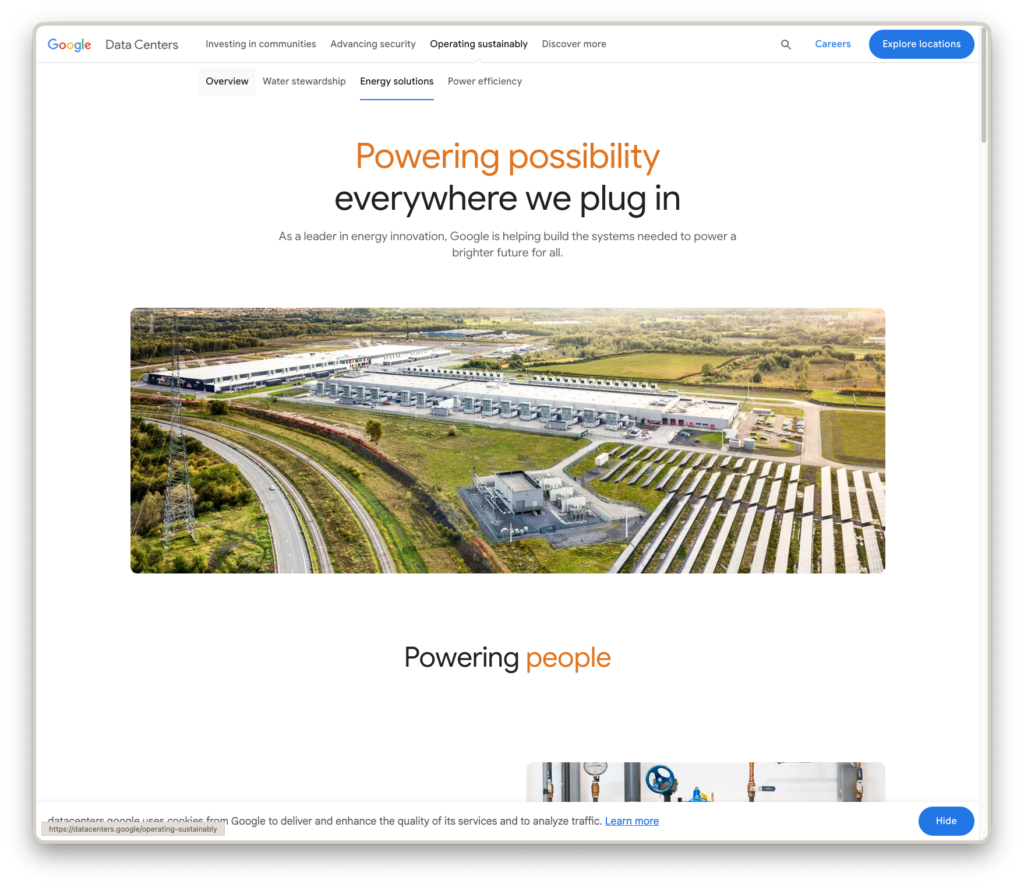
However, this doesn’t really represent the full picture. The density of energy demand inside data centres generally means that you need far more generation than you typically see next to facilities like this. If you have a 100 megawatt data centre, and solar panels require around 5-7 acres per megawatt, then you’d need around 500 and 700 acres of space—far more than is visible in this picture.
So our first question is about whether companies were being transparent about how much renewable power was really generated at the facilities, versus sourcing the power via other means that more accurately represent the physical realities of powering them.
This used a column from original dataset, renewable-energy-consumption-onsite. This was originally added to the dataset because companies operating in Europe already have to report this figure at a data centre level under the Energy Efficiency Directive. For companies that opted out of this disclosure citing commercial confidentiality, there is another law, the Delegated Regulation 2024/1364 that also requires companies to disclose this to the regulator in the country that their data centres are based in. So this means that we know this data exists, and is being disclosed, and to not disclose it is a deliberate decision.
Under these laws, this figure is typically reported at a data centre facility level. A cloud region is essentially a collection of one or more data centre buildings operating together, but the functionality it provides is exposed as an abstracted pool of ‘compute’, ‘storage’ or other digital resources. Reporting at a region level would involve rolling up the figures for each facility into an aggregated figure. However, neither of the three companies publicly disclosed this information.
2. Do they disclose their reliance on ‘unbundled’ certificates for renewable energy?
If data centres aren’t really powered by onsite green energy that much, what is the next most common way to power them?
Rather than relying on onsite clean energy generation, a quicker, cheaper short cut is to purchase energy from the local electricity grid, and then purchase “unbundled” annual clean energy certificates, that allow a company to claim that the power they are consuming comes from renewable sources for that specific year.
While this is accepted under the most common standards like the GHG Protocol Scope 2 guidance, this approach has been plagued with problems around credibility and consumer trust.
Based on our own experience operating a green energy checking service for web hosts, understanding which claims are based on onsite clean energy versus relying on certificates is a commonly recurring request. Arguably, a claim based around unbundled certificates is less credible than a claim based around on-site clean energy generation or even a long term power purchase agreement (PPA) that might fund the construction of a new wind farm.
We can look at the first set of aggregated figures published by the European Commission after the first year of Energy Efficiency Directive disclosures to get an idea of how widespread the use of these certificates are.
In Europe, these certificates are referred to as Guarantees of Origin, and the chart below shows how much more common they are used as the basis of a green energy claim, than either onsite clean generation or power purchase agreements (PPAs).
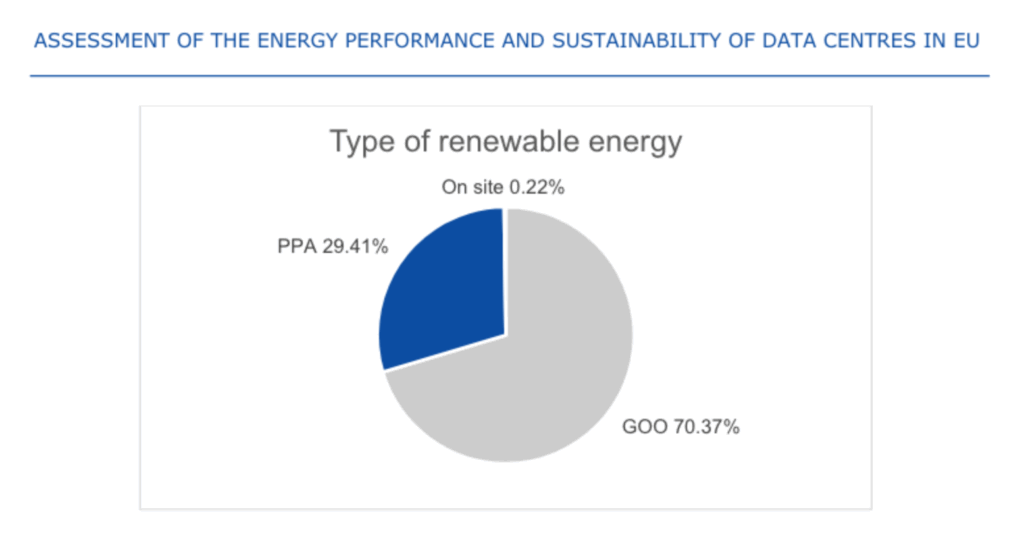
This, too, is a data point in the Real Time Cloud dataset, renewable-energy-consumption-goe. Again, in Europe companies have to disclose this at a data centre level under the same laws as they do for onsite generation. So, the data does exist to disclose this, and will have already been collected. But so far, no companies have publicly disclosed this at a region level in this dataset.
3. Do they disclose their use of carbon free energy on an hourly basis?
In response to the problems associated with unbundled annual certificates, a new, more credible way to claim clean energy generation is based around hourly clean energy certificates, that broadly follow the EnergyTag standard.
Under an hourly scheme, a claim to be using clean energy at night would have to be backed by a certificate for clean energy that was either generated at night, or generated during the day then stored in something like a battery until the battery was discharged at night.
This results in a more credible claim to use clean energy than before, because it more accurately represents what is happening on the electricity grids (broadly speaking solar panels don’t work at night…). This hourly basis will likely become the main standard for tracking the ‘greenness’ of energy in the GHG Protocol’s Scope 2 guidance undergoing reform at present. We will ourselves are updating our own verification process for the Green Web Check directory largely based on the expected shift to this hourly approach.
Both Microsoft and Google made public commitments in 2020 to transition to running entirely on clean energy backed by hourly certificates, and to do so by 2030. This is a column in the dataset, under provider-cfe-hourly. Google Cloud has a relatively high score for disclosure on this point, while Microsoft Azure and Amazon Web Services do not. Where Google’s score seemed lower than it ought to have been, we have opened a pull request on the project, to resolve the issue.
4. Do they disclose their burning of fossil fuels at specific sites in all regions?
The final question refers to the burning of fossil fuels in a given region on the same premises as the buildings that hold the servers in this region. This likely represents one of the biggest shifts we have seen in the recent years when we look at how data centres are powered.
Earlier, for the most part, the only real burning of fossil fuels by a data centre directly might be the occasional testing of backup diesel generators—only tens of hours out of the 8760 hours making up a given year.
However, this is something changing quickly in both new and existing regions for cloud services companies..
One clear case we see with existing regions is the set of onsite reciprocating engines on Microsoft Azure’s northeurope campus, that run on methane gas. This is not merely a backup power source. The public permit granted clearly states, this is intended to run for up to 8 hours a day, to supplement power from the local electricity grid. It’s also a meaningful share of the capacity of the facility. The 170 MW of onsite gas generation capacity would have been a very large data centre facility all by itself a few years ago.
Elsewhere in the same part of the world, we now see data centres relying on fossil generation as the primary source of power, as in a recent example of a 110 MW facility from Pure Data Centres in Dublin, Ireland. This is not generation as a backup, or as a supplement to the grid—this is part of a new trend of off-grid data centres.
While it is not publicly disclosed who the tenants are for this facility, this project is designed for hyperscaler tenants like the big three firms we mention.
There are other examples of the big three using offgrid facilities like this. Across the Atlantic, Microsoft announced a new project in March to run data centre facilities on more than gigawatt of offgrid gas power in Virginia. Elsewhere in Utah, authorities are voting on whether to approve a new 9 gigawatt, off-grid data centre facility, explicitly aimed at US hyperscalers. At full capacity, this would consume twice the power of the entire state, and be the one of the largest point sources of carbon pollution in the country.
Now that we know this is a key question to answer, what information do we have in this dataset, or in any others out there?
At present, this is not even a datapoint in this dataset. While it’s clearly a key indicator we care about, there is no precedent of disclosing the use of primary onsite fossil fuel powered generation. Even operators of data centres in Europe have so far only been expected to report at a data centre level for the EED on the quantity of fossil fuels they burn onsite as backup generation, so this shift is a new thing. However, this is in a new proposed data centre labelling scheme for Europe that was announced in March. For those curious, we’ve now opened an issue on the Real Time Cloud Working Group’s project on github, along with our reasoning, and proposal and you can follow its progress online.
How did we generate our transparency score?
As is plainly visible in our score chart, neither of the three companies have been publicly transparent in standardised ways that would enable us to track progress towards a fossil-free internet in any region.
For most of these data points there are 0% disclosures. Of the three providers, Google is alone in publishing figures for the amount of hourly matched power it uses at a region level in machine-readable form, on a public github repo. The dataset also covers other indicators relating to the sustainability of data centres like PUE (i.e. how efficiently they cool hardware), WUE (how much water they consume for each unit of power consumed), and so on. Fossil fuels are not being tracked in this data set, but we believe they should be.
This is our first attempt at developing this type of data driven transparency score, and we are happy to discuss and hear feedback. We hope (and expect) to see improvements in transparency from year to year.
For more, see our latest report, the State of the Fossil-Free Internet 2026, and if you have feedback or further questions, we’d love to hear form you – drop us a line.