Last year, we joined the Real Time Cloud working group in the Green Software Foundation, a project that has set out to define consistent, standard ways to report the carbon intensity of the computing hours sold by large cloud providers. We speak to friendly infrastructure specialist Ross Fairbanks, who maintains our cloud carbon intensity software libraries written in Go, and represents the Green Web Foundation in the working group, to learn more.
What is the Real Time Carbon Standard and what problem is it trying to solve?
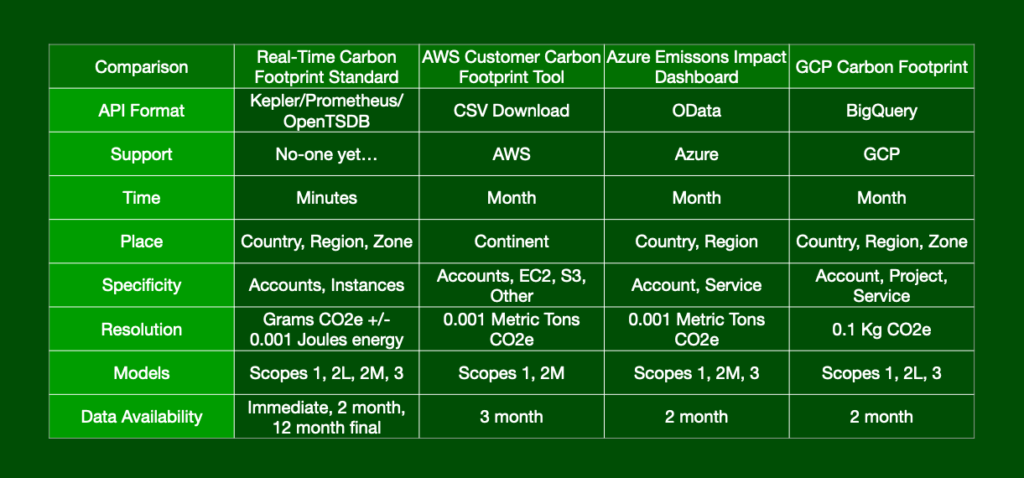
At present, the major cloud providers that make up more than two thirds of the cloud computing market (AWS, Google and Microsoft) publish carbon emissions data in different ways. Because they all have different ways of working out the carbon intensity of the electricity they use and reporting it, it makes comparisons and consistent reporting very complicated if you use more than one provider, or ever switch providers. Even if you use the same provider, there are still areas where standardising on what data is shared would help with more responsible design of systems.
An example of where this would help – time lagged data and carbon awareness
In addition, this data is reported on a range of different timescales – and data about the carbon footprint of the services you use can take up to three months to appear in existing dashboards and calculators.
This can make it much harder to use this data to inform the design of our systems.
We know that the carbon intensity of the grids we use is becoming more dynamic as renewable generation makes up a larger share of the grid. If we want to design systems that integrate better with an increasingly dynamic grid, we really need real time or close to real time data to design systems that work in a more carbon-aware way.
When we say carbon aware in this context, we are referring to time shifting and location shifting computation, as a way to minimise the amount of fossil fuels we need to burn to provide the electricity we use. Time shifting for example, is running non time sensitive tasks at times when more renewable energy is available – typically outside of peak demand hours. This reduces the emissions associated with that particular computing job, because we reduce the average carbon intensity of the energy used over our chosen time period.
Correspondingly, location shifting is running software at physical locations that have more renewable energy available. In the UK for example, you might choose to run computation in some parts of Scotland, which has much more wind energy on the grid than the south of England. Because the electricity powering your servers is greener, the carbon emissions from the computing jobs are lower too.
Right now, most of the metrics shared by most cloud providers make seeing the impacts these changes difficult at best – we really need higher time resolution data to be available to tell if what we’re doing is helping, and standardised measurements for the carbon intensity of compute would really help here.
Another major problem is that energy consumption metrics in the cloud usually rely on estimates rather than measurements. This is because some sensors built into servers that report energy usage figures are blocked for security reasons (more on that later).
Lastly, for multi-tenant applications where lots of organisations might be sharing the same physical hardware, we need to be able to attribute carbon emissions and energy consumption metrics to specific workloads belonging to specific users, rather than to a whole server.
The project sets out to define a set of metrics for real time energy consumption and carbon emissions that address these challenges.
The standard will use the popular Open Metrics format used by widely used tools like Prometheus, making it easy for many other platforms and kinds of software to either produce or consume these metrics. The aim is to get agreement from all the major cloud providers to implement the standard.
However, any hosting provider will be able to implement the standard too. If you want the same metrics for carbon intensity as are being developed, and you have access to power usage figures in your system, you can use our grid-intensity-go tool to create them. Our tool integrates with several providers of carbon intensity data, including Electricity Maps and WattTime. We have an open contribution policy, and code of conduct, and welcome contributions to support more.
Why is the Green Web Foundation involved in the working group?
Part of our mission is to track the transition of the internet away from fossil fuels, and for that to be possible, it’s important to understand how the proportion of fossil fuels used to power cloud computing is tracked.
By being part of the discussion, we’re able to raise concerns when a way of measuring something seems off, but also by being involved in the discussions where some of the organisations furthest along are defining standard, it helps inform the design of our own software, because for the most part the scope of the working group is focused just on the big three providers (Microsoft, Amazon and Google).
We think diverse ecosystems are healthy ecosystems, so our interest is in making sure the standards being developed work for a wide range of cloud providers, not just the biggest ones.
Which organisations are currently involved?
The project is chaired by Adrian Cockcroft and Pindy Bhullar and the original idea came from a talk that Adrian gave at QCon London in March 2023. So far the meetings have had attendees from AVEVA, Electricity Maps, Goldman Sachs, Google, Microsoft, NTT Data, WattTime, and Green Web Foundation (us). It’s been great to see people from across the industry coming together on this topic, and we’ll be reaching out to more organisations as the project progresses.
What have been the most interesting/surprising things learned along the way so far?
From my experiences contributing to the Scaphandre project I already knew measuring energy consumption in the cloud is much more difficult than on bare metal. This seems a bit counter intuitive at first. However, as I mentioned earlier, RAPL (Running Average Power Limit) is a key technology for measuring energy consumption of both CPUs and DRAM, and is usually blocked in the cloud.
I found the reason for this interesting. One of the reasons is a vulnerability in some infrastructure, officially called CVE-2020-8694 / CVE-2020-8695, which leaves some systems open to a cybersecurity attack known as the Platypus attack.

If you have high enough resolution access to energy data, it can be possible to use the readings to infer what data is processed, by looking at how the power draw of the CPUs change as they carry out different instructions. This permits side channel attacks to extract data an attacker shouldn’t have access to. When researchers first disclosed the existence of this attack, they were able to demonstrate the extraction of encryption keys from a server using this attack – which has pretty significant security implications.
Finding a solution to this is one of the project’s main goals. The solution proposed is to provide metrics at one minute intervals. This is close enough to real time to make our systems carbon aware but without making them vulnerable to this attack.
Another challenge related to RAPL is that energy measurements are per CPU socket. For multi-tenant systems like a Kubernetes cluster, the metrics are needed per container, and additional metadata like the pod name and namespace is useful to attribute the energy usage to the right users. The plan is to use Kepler, a CNCF sandbox project to do this attribution.
I’m also working with Kepler as part of the Green Reviews working group which aims to provide energy measurements for CNCF projects so they can reduce their energy consumption. We use bare metal servers for this to be able to access RAPL. The working group is part of TAG ENV (shorthand for the CNCF Environmental Sustainability Technical Advisory Group).
How can people follow along or get involved?
The project has its own repository in the Green Software Foundation organisation on github,where you can follow progress. You can open a discussion there if you have questions or feedback on the project.
If you’re looking for data, one of the more interesting datasets created is a unified table of all the large providers, by region, listing annual and hourly clean energy figures, using the most up to date information in the public domain, and is consistent across Amazon, Microsoft and Google.
If you’re looking for some working code, I mentioned earlier that I maintain grid-intensity-go, a Golang library, CLI and Prometheus exporter for accessing carbon intensity data. It supports multiple providers including Electricity Maps, WattTime and the UK national grid carbon intensity API.
If you’re looking to learn more about carbon aware programming, last year I wrote a blog post on carbon aware scheduling with Nomad and Kubernetes. The idea of the post was to identify capabilities or related projects of both orchestrators that can be used for time shifting and location shifting.
One of the projects we identified in that post for time shifting was KEDA (Kubernetes Event Driven Autoscaling), so I was very happy to see Microsoft release the carbon-aware-keda-operator last year. This makes it possible for people using that platform to build systems to respond dynamically to the reported carbon intensity on the grid – something more common with companies who had exclusive ownership of all their own physical infrastructure.
While having consistent ways to report carbon intensity across the largest providers might be helpful, one of the reasons I am interested in this work is that I want to see more providers who provide metrics like this, so there are more options available for decarbonising the systems we design. We are seeing more and more interesting new ways to run infrastructure, like shipping containers full of servers being attached to solar farms to use energy that would otherwise be thrown away (curtailed), to datacentres inside wind turbines, and even new hardware designs that connect racks of servers to greenhouses, or even swimming pools. But without consistent metrics, it’s harder to make the case to use them compared to the default options. I think this work can help.