Earlier this year, the Mozilla Firefox Profiler became the first major web browser developer tool to display carbon emissions alongside performance and resource utilisation metrics. This case study explores how Mozilla and Green Web Foundation made this possible by collaborating on the Profiler’s open-source code. In particular, it focuses on how the open data made available through the CO2.js library enabled this.
What is the Firefox Profiler?
The Firefox Profiler is an advanced developer tool that is built into the Firefox web browser. The profiler captures extremely low-level detail about the processes, functions, and resources that are required by a web page as it is used. This makes it extremely useful for developers looking to debug performance issues, memory leaks, and much more.
All major browsers have some kind of in-built profiler tooling. Profilers capture recordings (also called profiles or captures) as the browser is used. These recordings are then visualised and presented in an interactive timeline enabling developers to dive into what was happening as a particular web page was loaded and used.
Profilers predominantly focus on tracing JavaScript performance, memory utilisation and other such device metrics. Getting detailed information about how much power is being consumed by a browser has been hard to come by. Apple’s Safari browser has had an energy impact reading in its own profiler for some time. Though this does provide some guidance it lacks the extremely detailed figures that would allow developers to gain meaningful insights for a specific website or scenario.
Power measurements in Firefox Profiler
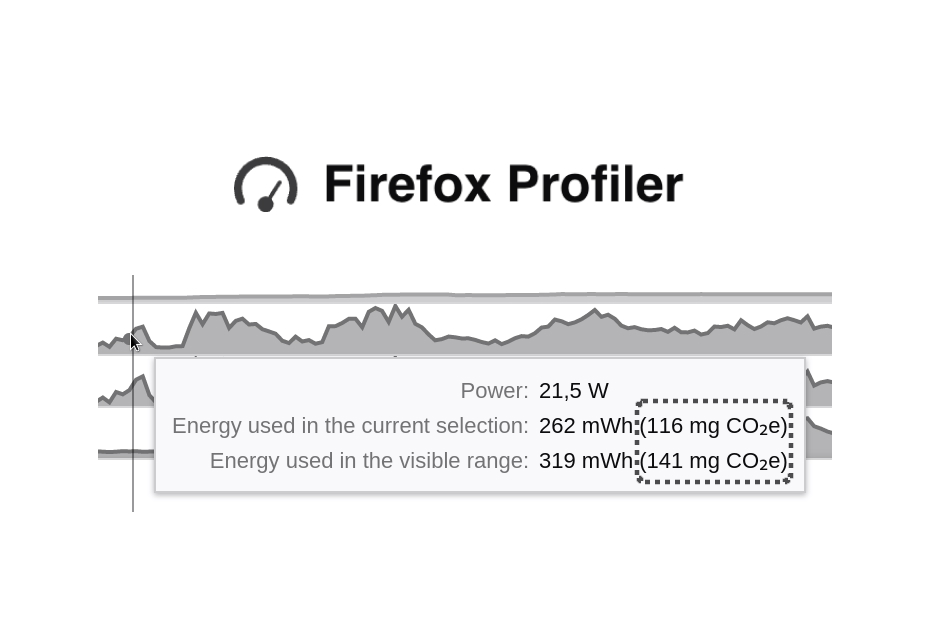
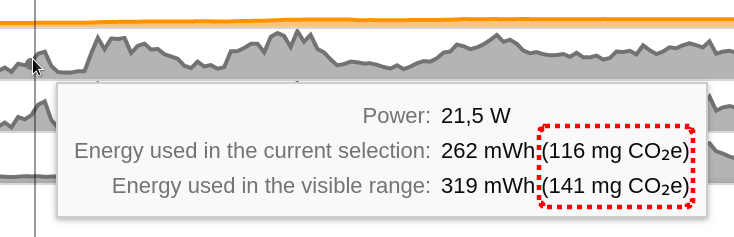
As of Firefox 104, the Firefox Profiler became the first browser profiling tool capable of capturing detailed power usage for a specific profile recording. This allows developers to visualise changes in the power consumption of a physical device as a website is being used and identify what part of a page’s activity consumes the most electricity.
As Florian Quèze of Mozilla explained this wasn’t easy. Accessing power information across Windows, Mac, and Linux platforms with different device architectures took years of work. Eventually, though, Florian was able to crack the case and introduce power profiling into the Firefox Profiler on desktop devices. At this time there is no way to capture a power profile for mobiles, but Florian is actively working on making this possible in the not too distant future!
Power profiling makes visible things that used to require guesswork. I hope it will enable developers to make informed decisions when thinking about how their sites impact user devices and web sustainability.
Florian Quèze, Mozilla
Why does having device power usage data matter?
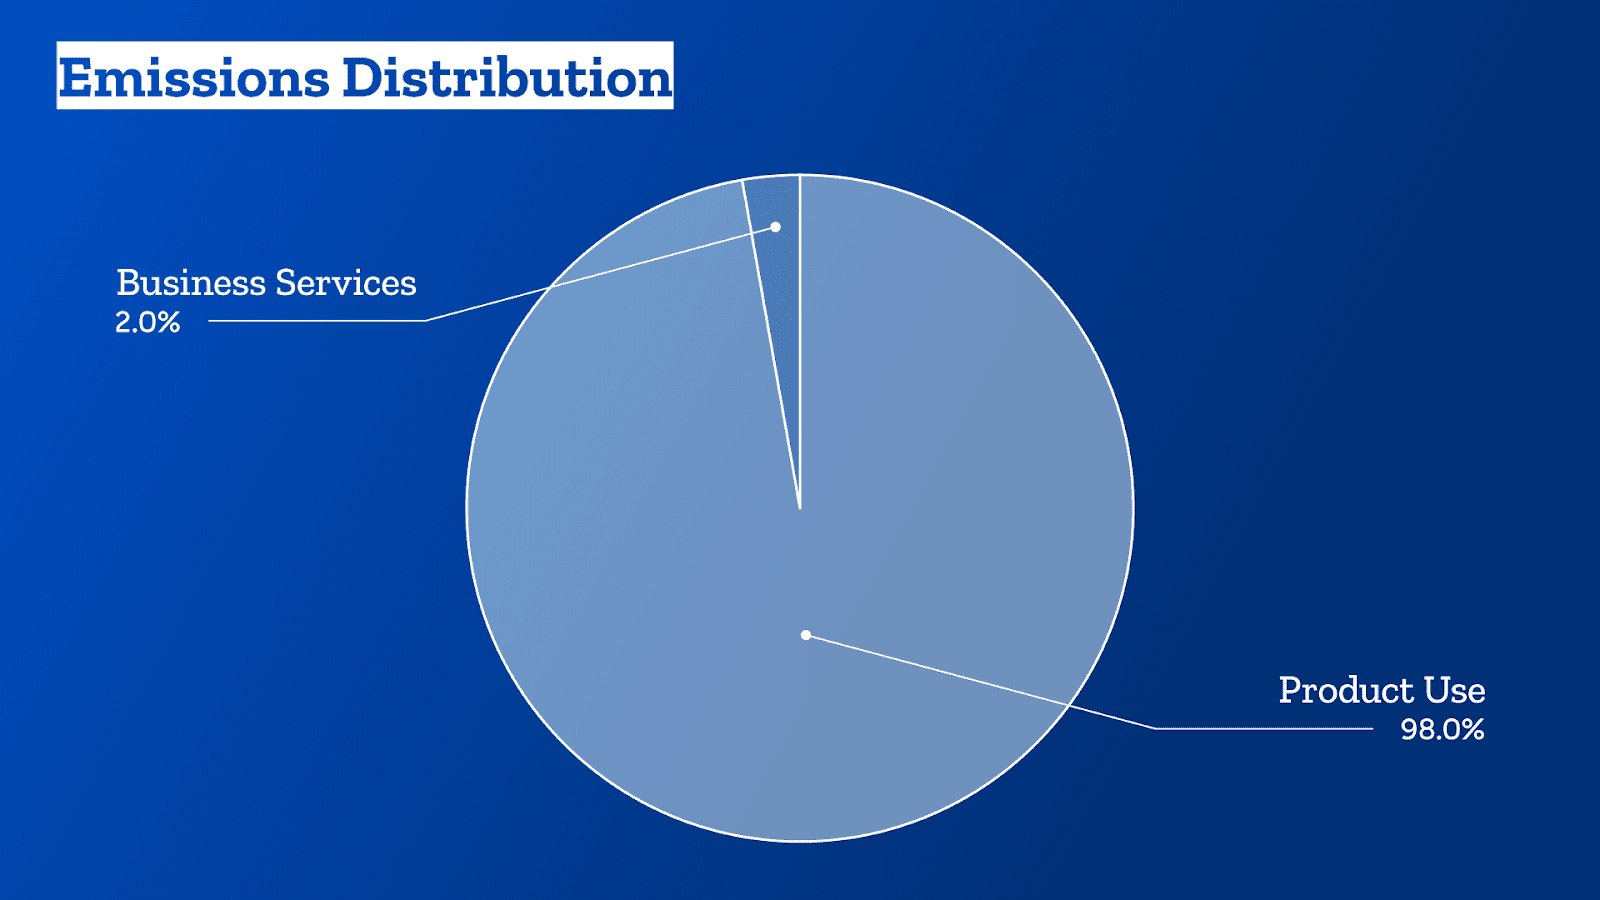
The impact of end-user devices (like smartphones, laptops etc.) is significant. One only needs to look at Mozilla’s own greenhouse gas emissions findings. They found that usage of their software products accounted for the overwhelming majority of their overall emissions footprint.
Having device-level power measurement integrated into web browsers is crucial in a future where accurately calculating overall digital carbon emissions is becoming ever more important. Being able to access real insights into the power consumed by individual devices when accessing online content is important for both developers and researchers. It can allow developers to make more informed sustainable web development decisions. For researchers, it provides vital data that can be used in refining the accuracy of power and carbon estimation models.
Adding carbon emissions to the Firefox Profiler
Our own Chris Adams met with Florian at a Berlin hackathon in 2022. Sometime during their conversation the topic of Florian’s work on bringing power usage data into the Firefox Profiler came up. Florian had just released power profiling for Firefox running on Mac (Apple Silicon) and Windows 11 devices. He was also actively working on getting the same feature introduced into Firefox on Linux.
At around the same time as Florian was working on getting power profiling into the browser, we at Green Web Foundation were also working on bringing grid intensity data into our CO2.js JavaScript library. Our goal was to make this data open and accessible to developers who were looking to surface carbon emissions estimates in their projects.
When Chris found out about Florian’s work, he realised this was precisely the kind of use case that the recently introduced grid intensity data in CO2.js could be used with. Shortly after, Chris opened a pull request to start showing carbon emissions results in the Firefox Profiler.
If you know how much power you’re using, and you know how carbon intense the grid you’re using is, then you can multiply one by the other to get an idea of the carbon emissions from using that electricity.
Chris Adams, Green Web Foundation
How Mozilla Firefox Profiler uses CO2.js
CO2.js is an open-source JavaScript library that enables developers to estimate the emissions related to use of their apps, websites, and software. It is built to reduce the barrier to entry for developers who want to build carbon estimates into the apps and sites they build. One of the ways we make this possible is through the inclusion of openly accessible annual grid intensity data for countries around the world.
What is grid intensity?
The electricity that powers computers running code comes from a variety of sources – renewable, low-carbon, and fossil fuel based. We call this the fuel mix. Grid intensity is a measure of the CO2 emissions associated with the fuel mix used to generate the electricity of a particular region.
CO2.js includes annual average grid intensity data from Ember for countries around the world. It also includes regional, and a global grid intensity figures from the same data source. It is this global figure which has been used in the Mozilla profiler to present carbon emissions estimates alongside power usage data.
How is grid intensity data from CO2.js used in the Firefox Profiler?
Since the Firefox Profiler is an open-source React application, integrating CO2.js into the project was just an npm install away. Okay, it wasn’t as simple as that, but it’s how we got started.
Initially there was a brief back and forth about how carbon emissions figures might be presented in the profiler. It was decided to show carbon emissions alongside power usage in the same track, rather than breaking them out on their own.
The Firefox Profiler team also had some reservations about how CO2.js could be used within the profiler. These were concentrated on a few key areas that revolved around user privacy when capturing a power profile.
Limiting outbound requests
When looking up grid intensity data, the Profiler dev team wanted to avoid making any outbound web requests which could potentially expose the location of a user. Since CO2.js ships with annual average grid intensity data as part of the package, all the required data is already statically available inside the Firefox Profiler. This meant that there was no need to make an outbound request to fetch that data.
Avoid storing location data inside a profile
Another concern of the Profiler dev team was that if we were to store carbon emissions inside a profile, then some location information for that profile would also need to be kept. To get around this, we opted to use the global average grid intensity which would give a carbon emissions result in the profile without revealing the location where that profile was captured.
One drawback of this approach is that carbon emissions shown in a profile might not be representative of the real world situation when that profile was captured. For example, a profile taken in a country that has low grid intensity (lots of green energy on the grid) would overestimate emissions. Vice versa for a profile captured in a country with a high grid intensity.
We’re hoping that future versions of the Firefox Profiler can solve this, and have raised a GitHub issue to track this. The Mozilla team has already been proactive in looking for possible solutions that still respect user privacy.
How to use the Firefox Profiler to record carbon emission
This case study is already quite long, so rather than go through a step-by-step guide on how to use the profiler, we suggest you take a look at this blog post: Power measurements and CO2e estimates in Firefox Profiler.
It is worth noting that the power utilisation tracks you see will vary depending on whether you’ve captured the profile on a Mac, Windows, or Linux device. On all three, though, you will still see carbon emissions alongside the power measurements.
Where to from here?
Having access to actual energy usage figures from real world devices is critical to the IT industry being able to measure, understand, and eventually reduce the impact it has on the planet. The work by the Firefox Profiler team is pioneering, and we’re delighted that CO2.js is able to play a small role in surfacing carbon emission data to developers around the world.
That being said, this is very much a first step. There are a few things we hope to see in the months and years to come which build on top of this groundbreaking work:
- More location specific results – As we touched on earlier, the Firefox Profiler dev team has already begun working on ways to allow for more accurate, location specific, carbon emissions results to be produced whilst respecting privacy.
- Having data programmatically accessible – Currently, the power usage and carbon emissions data captured when a profile runs can only be accessed manually by a user viewing that profile. Being able to make this kind of data accessible programmatically would open up entire new avenues for developers to build accurate tooling to track and measure the real world impacts of web browsing activity. There’s an open conversation about how this might be possible in the Sitespeed.io repository for those who want to follow along.
- More browsers following suit – With Firefox paving the way, we’d love to see other browsers explore how they can also surface both real power utilisation and carbon emissions results as part of their own internal profilers and developer tools.
Highlighting emissions in your tools?
If you’re a browser developer or software vendor that’s highlighting carbon emissions in your tools, then we’d love to hear from you and learn together.
If you’re just getting started, Green Web Foundation also offers consulting and advisory services to provide guidance and support to your developers.