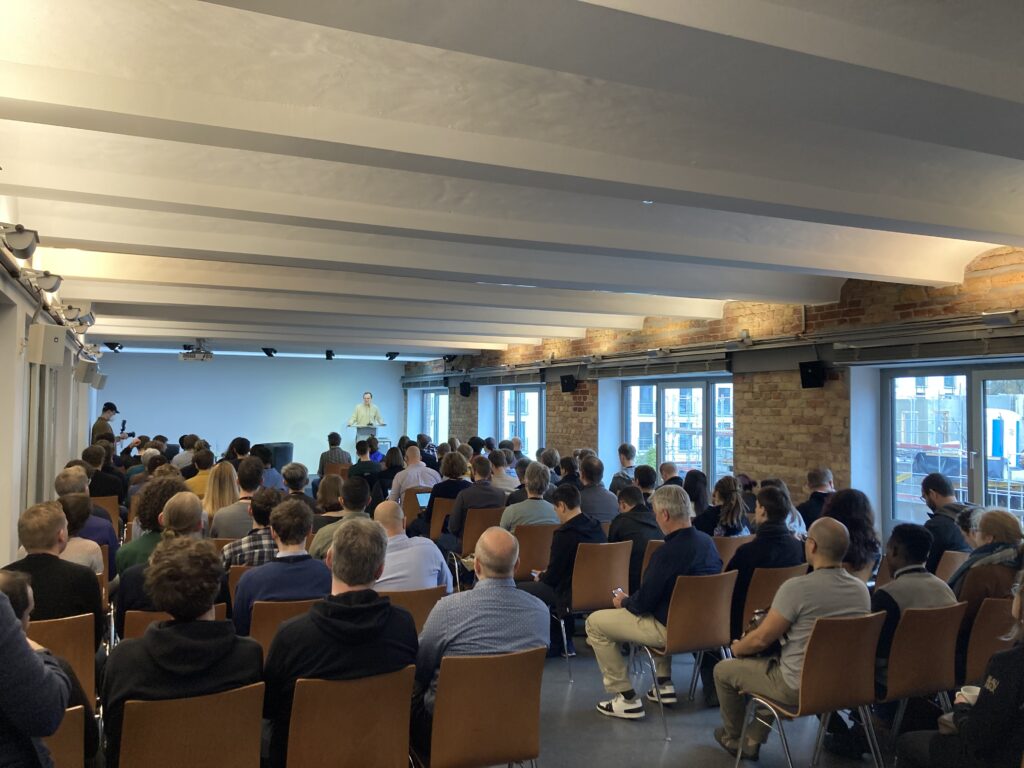
Earlier this month the SDIA Green Coding Summit took place in Berlin. It was first of its kind, and was co-organized with the German Environmental Agency (the Umweltbundesamt) & financed by the Ministry of Economy & Climate Action (the BMWK). Some of our staff are based in Berlin, and we delivered a fireside chat sharing our experiences in this field on the first day, and a hands-on coding workshop on the second day. It was a fantastic event with more than 200 policy makers, technologists and members of civil society involved – Chris Adams shares a few takeaways from the two days.
A few years back, the idea of a mainstream conference dedicated to Digital Sustainability, that had a mix of techies AND people who work in other vital areas, like policy, procurement and campaigning organisations – would be little more than wishful thinking.
So it’s a measure of how quickly the field is developing, that in 2023, in the 3rd largest economy in the world, you have an event that a) essentially was this and b) was seen as important enough that the same country’s government sent along their state secretary to deliver an opening keynote to outline why this topic matters.
So, why does this topic matter?
Well, the short version goes along these lines:
We’re in a climate emergency – every sector needs to make changes to avoid as much climate induced harm as we can. The tech sector is no different.
The longer version is more like this:
We’re in a climate emergency and every sector needs to make changes to meet the challenges brought by our changing climate, including the tech sector. Many organisations have a sustainability blind spot when it comes to digital. As we learn more, even leaders in the field are finding that digital services make up a significant share of their own emissions when they look into the topic in detail. Right now, it’s often hard to measure accurately, so we need policy support, better standards, much more transparency and collaboration to come up with meaningful paths to reduce the the environmental harms associated with digital services.
Anyway – back to the event. It’s worth highlighting the government support behind this, with keynotes from State Secretary Dr. Franziska Brantner and Anna Zagorski from the Umweltbundesamt, both of them highlighting the need to address the environmental impact of software itself – generally, if you hear governments talk about sustainability and tech it’s almost only ever talking about how we need more digitalisation to deliver on sustainability goals. So seeing policy makers talking about how software & digitalization is not a free lunch is refreshing, and welcome.
Almost every session was recorded, and the videos will be published online shortly.
Day 1 – learning about the field, connecting with others
If you look online, it’s not hard to find information about Green IT, and companies bragging about how sustainable they are. It’s harder to find out precisely how greener practices were adopted in the first place, what the drivers are for doing so, and what it looks like in practice. Thankfully, this was one of the things covered in the panels on the day. I’ll share a few key points below.
- In professional services firms, digital can make up to 40% of their organisation’s footprint
One of the key takeaways for me from the day was how large a share of their own carbon footprint digital services can make up, particularly for professional services firms. During a panel with staff from a number of companies sharing their stories how they began their journey working on digital sustainability, a representative of ABN Amro, the third largest bank in the Netherlands, shared some interesting numbers for context.
When they measured their own digital estate, the found out that it represented around 40% of their own carbon emissions. As a company covered by regulation like the recent EU Corporate Sustainability Reporting Directive that reached final approval a few days ago, they’re required to measure and report these figures at a level of detail that wasn’t required before.
This isn’t that different from a figure shared with me in an interview I conducted with a subject matter expert at Salesforce, where they said on the record that cloud emissions make up around half of their reported carbon emissions.
I work in this field every day. People are gradually getting better at measuring the environmental impact of digital services, as well as talking about it. I don’t think I’ll ever get used to these numbers.
2. Transparency is still a problem, but multi stakeholder collaboration helps
One of the reasons numbers like this might be surprising is that historically, there have been few incentives to disclose them, so they’re not something we’re familiar with. If you’re a company selling cloud services, the money you make is directly linked to the quantity of computing hours you can sell – so you might not want to remind people there’s an environmental impact associated with each computing hour consumed (you can see more in this very detailed spreadsheet deep dive screencast into the economics of cloud).
You can also see this manifest in the design of some calculators provided by platforms themselves. Like Amazon’s own cloud carbon calculator, which almost seems designed to disincentivise acting on the data. Rather than the actual location based figures, in many cases you only ever see netted out market based figures in your dashboard, showing a parade of zeroes for your use in each region – implying there are no environmental consequences for further consumption.
By contrast, tools like open source Cloud Carbon Footprint are designed and built in the open, are clear in their assumptions, and try their best to provide meaningful, consistent numbers across providers. Moreover they are extendable. This is something we learned more about from the maintainer of the project, Thoughtworks’ Cameron Casher, who presented on the day.
A number of organisations, when faced with different incompatible calculators from the providers themselves, are now using tools like Cloud Carbon Footprint, and extending the tool when they run their own infrastructure, to gain a consistent view across all the different ways they consume digital services.
This need for transparency and consistency is one of the reasons we work with the Green Software Foundation on their Real Time Cloud project, as well as the SDIA, to work towards clear, accurate and consistent numbers for cloud consumption.
3. Some of the most advanced tools for digital sustainability are free, and open for everyone to use
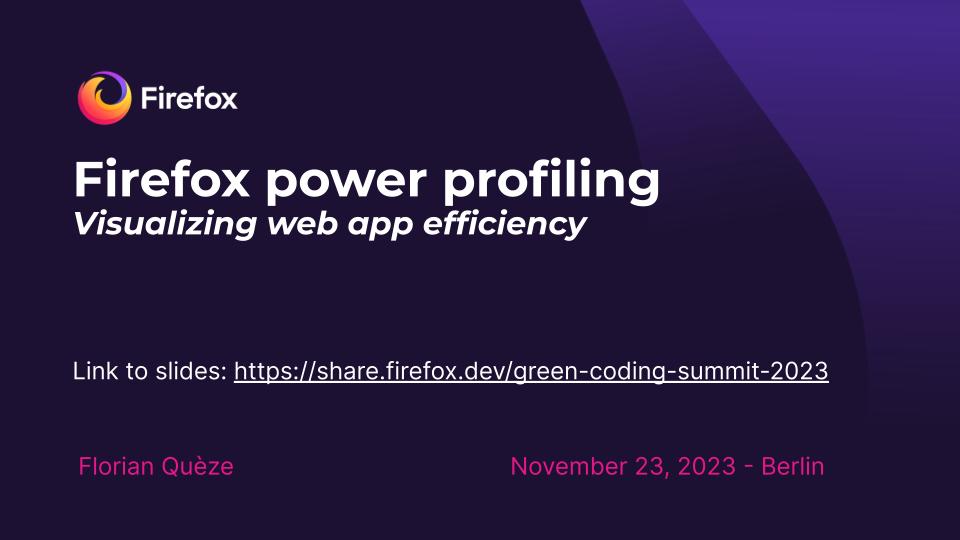
Continuing the theme, Florian Queze at Mozilla also presented his latest work showing off the tooling built into the Firefox browser to allow developers (and anyone really) to understand the energy usage caused on their own devices when accessing websites and services through a browser.
For the most part, even if consumer products show information around energy usage, figures are often not exposed in absolute terms that might support comparing one company’s products to another.
For example, Apple’s own Activity Monitor tools show energy, but don’t show you any units for its charts. While there is data available, if you want to present actual absolute figures with commonly accepted units to a user of a device, you often need to resort to some gnarly reverse engineering of hardware to do so.
Thankfully, it only takes one person to do this once for it to be put into software that can be run on anyone’s machine. That is precisely what Florian’s talk took us through, explaining how they built the Firefox Profiler’s power features, the lengths they had to go to to access the required data, and how it can be used.
As far as I am aware, if you want to understand the energy footprint of a website, the Firefox Profiler is the most advanced open, free tool on the market. This is also why we devoted time to it for our workshop on the second day.
Day 2 – Workshops, workshops workshops
If day one was about sharing what you know in front of a larger audience, day two was about deep dives, and getting hands on with the subject.
Diving into the impact of environmental impact of AI
From France, the non-profit Boavista designed and ran workshops on quantifying carbon emissions for AI / Machine Learning, as well as going beyond carbon, to understand the impact of digital services.
Being the good eggs they are, they published the slides for both of their workshops for the world to see – even if you couldn’t make it, they’re full of useful information. See the AI deck, and see the more general infrastructure deck.
End-to-end Green Metrics with the appropriately named Green Metrics Tool
Elsewhere, Green Coding Berlin showed how to track the energy usage end-to-end for a digital service, using their Green Metrics Tool. We used this tool ourselves when working with the Wagtail CMS community, and are big fans. You can see the page dedicated to the event on their site, along with a link to the (very technical) deck they worked from on the day.
A workshop for the front end with the Green Web Foundation
For folks who specialise in front end work, we ran a workshop of our own, teaching people how to model and measure carbon with CO2.js, our open source software library, in progressively more detail.
We introduced a few of the most common emission models, and showed how to use them in an interactive online “playground”, before showing how to apply this knowledge in well known software used every day by web professionals.
We showed folks how to use these models in WebpageTest – one of the market leaders in web performance optimisation, and also in Mozilla’s own Firefox Profiler.
One unexpected delight from our workshop was showing an attendee an open source tool for measuring carbon we had worked on before, Sitespeed.io – and as a result of them attending the workshop, finding out that they had gone on to use what they learned, and the same day, contributed new code to make something possible that wasn’t before the workshop.
I was fielding a question about how to automate a profiling run with Firefox’s Profiler – something we need to do manually right now. Because no other tool provides the level of detail that it offers, being able to do this on an automated basis would be really helpful for anyone wanting to improve the design of a page, or catch when a page goes outside a pre-defined carbon budget, like we do with performance budgets.
During the workshop, we showed an open issue on the project, explaining where we had asked the same question as had just been asked in the workshop. That was enough to get them going!
You can see the full deck used in for our workshop elsewhere on our site. Like the rest of our content, it’s available under a permissive license, as long you remember to attribute the source.
Where to go for more information
It’s now been a week since the event, and you can see a number of other writeups on social media if you search for the hashtag #gcs2023. You can also see a recorded post-event interview between SDIA founder Max Schulze, and myself, on youtube, and LinkedIn.