Last week, UK Power Networks, one of the larger grid operators in the UK shared some data about the current and future consumption of datacentres in their part of the country. This is relevant to people who want to see a fossil-free internet in the UK, and there are pretty eye opening findings from the published data. In this post we look through the data, explain what some of what it means in a country that has committed to almost completely transitioning its own electricity grid off of fossil fuels by 2030.
At the Green Web Foundation, we track the transition of the internet away from fossil fuels. Getting off fossil fuels involves replacing all the existing generation of electricity from burning fossil fuels with cleaner forms of generation. This implies understanding how much electricity consumption is being used now, and also how it is likely to change.
Having access to grid data like this is helpful, so what does the new data tell us? Here are a few insights below. In each case we link to the underlying data, so you can see the information for yourself
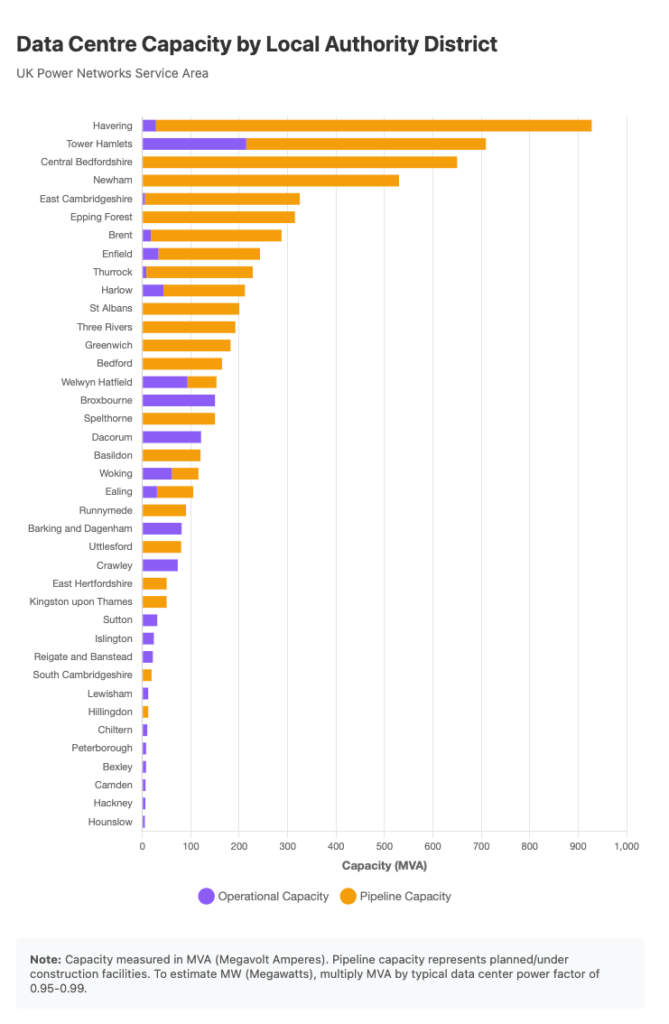
Massive planned data centre expansion in the South of England
Below is a chart generated from data published on the open data platform of UK Power Networks, a UK grid distribution network operator, responsible for the physical delivery of power over the last mile to where power of consumed in London, and parts of South and East of England. They list Data Centres by Local Authority, and it shows the electricity grid capacity allocated to datacentres, both now, and in the future. This is anonymised data, so the actual identity of the companies is removed, but it still tells us some interesting things.
The purple bars represent the datacentre capacity now. The orange bars show is what is planned, in the pipeline.
A caveat:
The published data does not show the expected dates, so we can’t see when these projects are expected to be completed, but we can see this on the data portal:
Pipeline data centre projects are projects that have accepted their connection offer, paid the application fee and have been committed to our delivery plans.
We don’t work with grids every day, but to us, this suggests these are not totally speculative requests to have power on the grid. It’s not unreasonable to assume these would be intended to be built between now and 2030.
We have linked to the relevant page in the open data platform above, if you want to see the data yourself, but you’ll need to sign up.
What does this tell us?
This is a massive amount of new datacentre capacity to plug into an existing grid that is trying to decarbonise. When you add up all the current datacentre capacity right now, you end up at a figure of around 1000 MW (out of an estimated 1600MW of power consumed by datacentres in the UK today, going by the UK government’s official briefings to parliament.)
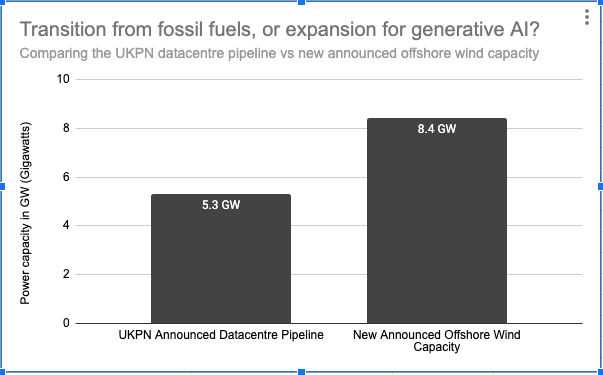
However the expansion of planned capacity is immense – around 5.3 GW (5300MW) of datacentre capacity is in the pipeline.
Is this a lot?
When we look at these figures in isolation, because most of us don’t think megawatts or gigawatts it can be hard to put this in context.
For comparison though, we can look at how this relates to the UK’s existing efforts to decarbonise the grid right now, and a recent announcement about the UK government’s support for a huge amount of new offshore wind generation. Here the UK government carried out a reverse auction to buy new clean energy, intended to clean up the grid for everyone. This auction was huge, and represented around 8GW of new clean generation capacity.
This new power is touted as being able decarbonise around 12 million homes’ worth of electricity, but at the same time, the 5.3 GW datacentre pipeline mentioned above represents more than half of all this new capacity. Once you take into account the fact that datacentres run 24/7 and that offshore wind doesn’t (because it’s not always windy around the UK), then you can see how all of this new wind clean capacity would be swallowed by this new demand, rather than cleaning up the existing grid.
Let’s make this visual for comparison (here’s the data in a spreadsheet):
Why does this matter? Well, decarbonising a country is much easier when the new capacity is going to actual transition from fossil fuels instead of just expansion. When new clean energy only goes towards new demand, it doesn’t help as much as when it displaces existing, polluting forms of energy generation, or existing polluting activity, like burning fossil fuels to power cars or heat homes.
How could this be changed? If building new datacentres comes with new, additional clean power then it can help address the decarbonisation issue at a national level (see our post about this for more detail).
We still need to consider the localised impacts of datacentres, and some additional data raises some new questions about how datacentres actually reserve power on the grid vs what they actually use.
Let’s look at that.
Using capacity on the electricity grid versus reserving it
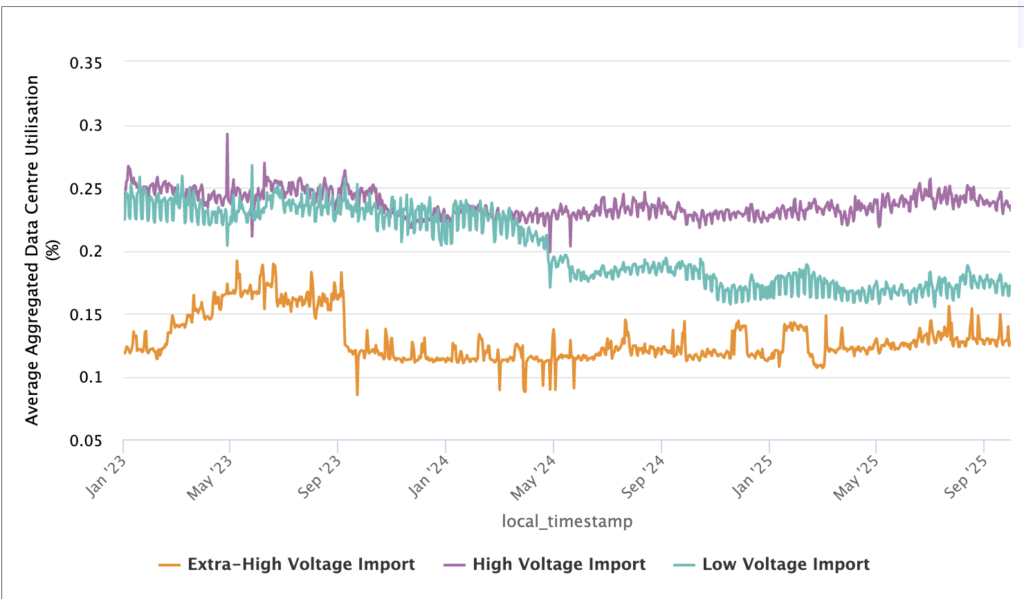
Another dataset was released last week that is worth attention too. Here’s the chart generated by from the site, based on aggregated, anonymised data the fleet of datacentres, based showing how much of the grid connection they have reserved, on a half hourly basis.
It’s quite a dense chart, so I’ll explain what it’s telling us below, but like before, for the nerds, this data is available online for you to look into as well.
What are we looking at here?
These oscillating lines represent the percentage of the grid connection allocated to datacentres that actually gets used by them, and shows us data going back more than two years to the beginning of 2023.
So, if a datacentre has 100 MW of grid capacity allocated to them exclusively (i.e. it isn’t available for others to use, to guarantee their supply), and they are using 0.25 of capacity on the chart, they’re actually drawing something more like a quarter of their connection, or 25MW of power.
Depending on the size of a datacentre facility, you might have different kinds of connection to the larger grid – this explains why you have low voltage imports, high voltage imports, and even extra high voltage imports. But really, the main thing to pay attention to is the percentage of a grid connection being used.
What does this tell us?
Again, this tells us some interesting things too.
Most datacentres are using nowhere near their full existing, allocated grid connection.
This is an echo of what our friends at Leitmotif found when they did some analysis of the datacentre data consumption in Netherlands, based on published data facilities had to disclose as a result of the European Energy Efficiency Directive.
It also raises the question – if datacentres are not even using their existing connections, why do they need so much more already? We like computers and tech as much as the next person, but it’s not clear why so much capacity is being allocated them, ahead of cleaning up existing sectors, especially when existing capacity isn’t being used.
As before there are some caveats: datacentres are designed for reliability, and to achieve reliability that you often need redundancy, which means having at least two of everything (often referred to as an N+1 approach). In some cases this can extend to the actual grid connection, so if you have a datacentre that has a capacity of 20MW, and it has two grid connections that always need to be available, from the point of view of the grid operator it can look like they’re really reserving 40MW of grid capacity, even though they’ll never be able draw more than 20MW of power from grid at any point.
To make this concrete, if a datacentre is only using half of the power allocated to it, this would show up on the chart as only a quarter of the capacity of the grid connection.
However, even if we account for this, we still see utilisation hovering around the 25% mark. Allowing for this redundancy, this would still barely be half the capacity allocated to them,
Why would you do this? It may be the case that as a datacentre operator saw, you (justifiably) see applying for grid capacity as a slow process. You might want to leave room to grow when you apply, to avoid having to wait ages to expand each time.
The thing is, this already shows there already is room for growth – at most, only half the capacity of the grid connection in constant use.
Datacentre demand does change over the course of a day, but in its current shape it doesn’t change that much
This is important for discussions around grid-aware, or carbon-aware computing.
Within a single day, you can see the daily patterns that broadly show that as more people use computers during the day, it leads to a small increase in power demand within the actual datacentres themselves, as the servers respond to more requests from people.
However the swing is not that large at present – for the most part, the daily swing is in the single digits of percent.
Why does this matter? Most of the time, most of the electricity grid has spare capacity – in it’s only a small number of ‘peaky’ hours in a given year that the full capacity of an electricity grid being used. During these peaks, the energy generated is both dirtier and more expensive than usual, so if you can be flexible about how much power you can use, it can save on money, pollution, and even avoid needing to build new generation at all.
But if we can see that datacentres don’t really change much in terms of how much power they use, how can they be flexible?
Instead of changing how hard the servers are working is running, one other way is to temporarily change where the power the servers runs on is coming from. So instead of drawing power from the grid, they might run on local power generation, from diesel generators (not great, often even dirtier than the grid), or batteries (better, often cleaner than the grid).
However, as the data shows this, this is very rare at present, although this is an area under development – we have a post coming about a deep dive workshop we are part in the coming week.
Where do we go from here?
We think that data like this helps us have a more data informed discussion about both the decarbonising of a sector like the digital sector, but also how it happens in the context of a national transition away from fossil fuels.
Knowing how existing datacentre capacity is used right now also adds extra nuance to public conversations about how it gets allocated in future, and what conditions are needed to stop them wrecking national climate goals.
It’s good that this data is being published in the UK, and hopefully we’ll see this level of detail in other places. If you have seen some in other parts of the world, and let us know, and if you’d like us to help you make sense of it, well, we’d love to hear from you.
A huge thank you to Chris Pointon for the pointer to the UKPN dataset being published 💚