A public roadmap and playground for CO2.jsby Fershad Irani18th November 202418th November 2024CO2.js, Tips & resources
Understanding the latest Sustainable Web Design Model updateby Fershad Irani4th June 20242nd July 2024CO2.js, Grid/carbon aware
Google Season of Docs – CO2.js contributor pathwaysby Fershad Irani16th April 20243rd May 2024CO2.js, Publications, Updates & events
Why web perf tools should be reporting website carbon emissionsby Fershad Irani8th December 20238th December 2023CO2.js
A Carbon-Aware Internetby Michelle Thorne30th November 20231st December 2023CO2.js, Grid/carbon aware
Estimating website emissions in the italian context – Sitigreen & CO2.jsby Fershad Irani23rd November 20231st December 2023Case studies, CO2.js
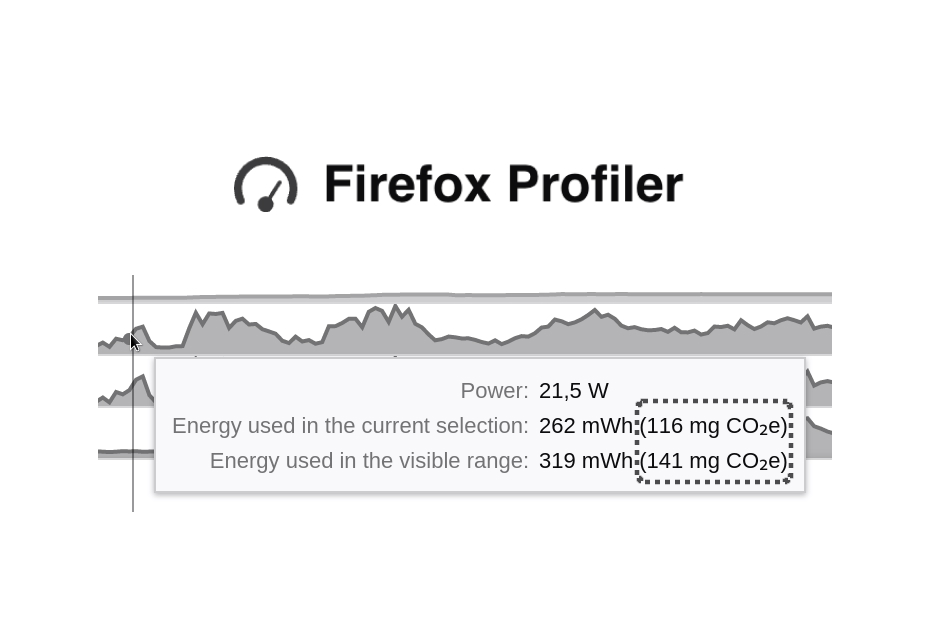
Carbon Emissions in Browser DevTools – Firefox Profiler and CO2.jsby Fershad Irani31st August 20235th September 2023Case studies, CO2.js